What is a quadrat?
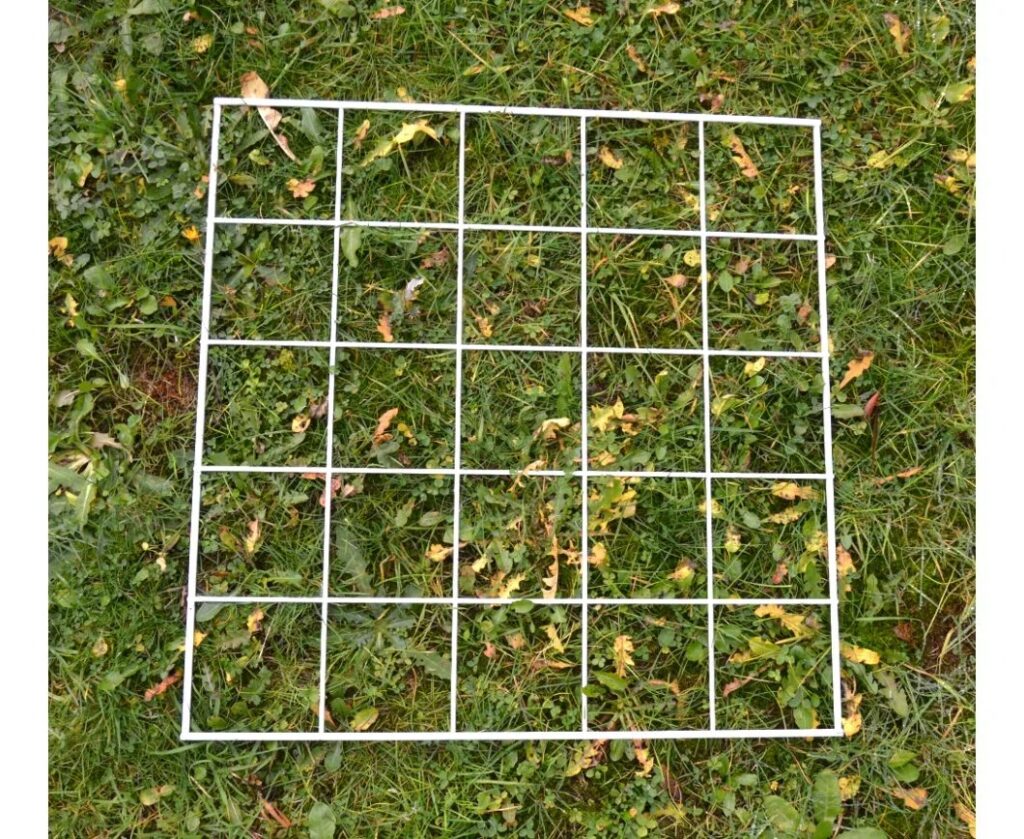
A quadrat is a square frame, usually constructed from wire or plastic-coated wire, although they can be made from any sturdy material. Most commonly they measure 50cm x 50cm (i.e. 0.25m2), and may have further internal divisions to create either 25 squares each measuring 10cm x 10cm or 100 squares measuring 5cm x 5cm. Some frames are also collapsible which allows you to connect several pieces together to create larger sample areas.
What are quadrats used for?
Quadrats are used to survey plants or slow-moving/sedentary animals. They can be used either on land or underwater to gain an estimate of:
- total number of an individual (or several) species.
- species richness/diversity – the number of different species present in an area.
- plant frequency/frequency index – the uniformity of a plant’s distribution within a surveyed area (not a measure of abundance).
- percentage cover – useful in situations where it is difficult to identify and count individual plants, such as grasses or mosses.
By deploying several quadrats it is possible to compare any of these factors either spatially (for example in locations with different light or pH levels) or over time, such as at different points throughout the year.
How to use a quadrat
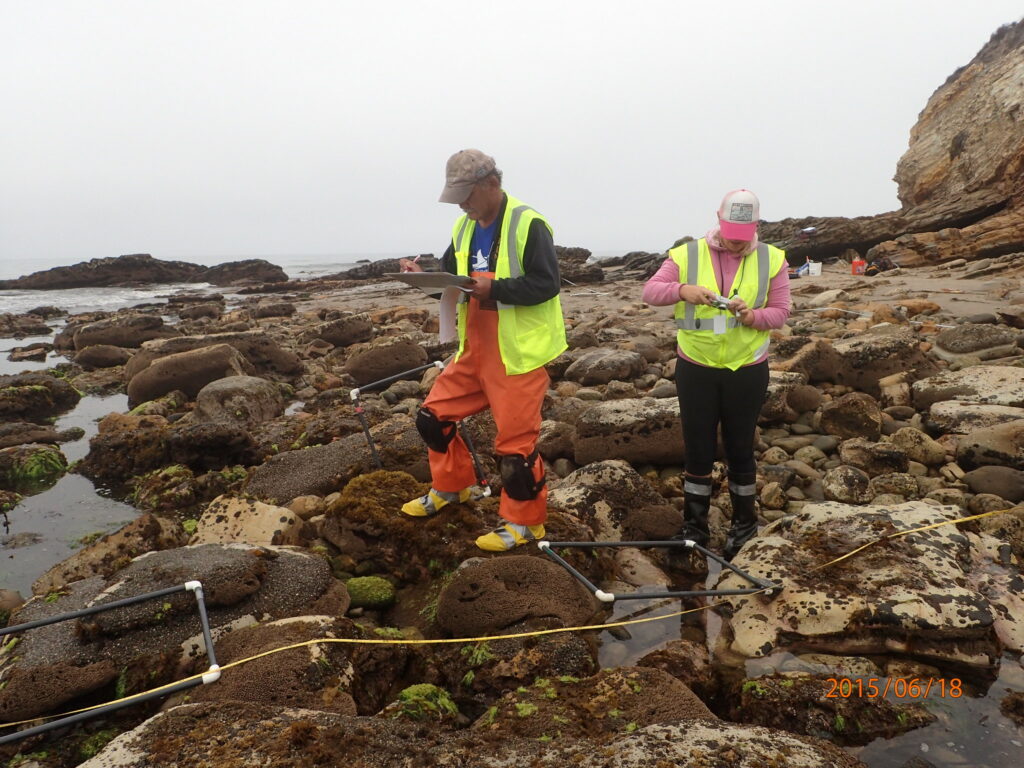
Most surveys require that quadrats are placed randomly within the survey site. One way to ensure that placements are truly random is to divide your survey area into quadrat-sized spaces and then use a random number generator to choose x and y coordinates. The quadrat can then be placed in the appropriate position. The number of samples you require will depend largely on the size of your survey site and the amount of time/manpower you have available. A minimum of ten samples should ideally be used.
In some situations, more specific placement of the quadrats is required. For example, when studying the changes in species presence/abundance on a shoreline, you may wish to take samples at regular intervals along a transect up the beach.
Creating a species list
One of the simplest ways of using a quadrat is to create a species list. To do this, the quadrat is placed randomly several times within the target area and the plants present within them are recorded. This will not provide any information on abundance or distribution, but will be a useful guide as to the species that are present at the time of sampling.
Estimating the total number of a species
For plants or animals that are easy to count, it is possible to estimate their total numbers for your survey area. To do this, simply count the number present in a series of quadrat samples then divide the total by the number of samples to get an average count per quadrat. If you know the dimensions of your entire survey site you can then multiply this up to get an estimate of the total number of a species present.
Estimating plant frequency/frequency index
To calculate plant frequency or frequency index, you simply need to note down whether the target species is present or absent within each quadrat sampled. The number of quadrats in which the species was present should be divided by the total number of samples taken and then multiplied by 100 to get the frequency as a percentage. For example, in a survey where 10 samples were taken, dandelions were found in 6 of these. This would give a frequency index of (6/10) x 100 = 60%.
Estimating percentage cover
For species in which it is difficult to count individual plants (e.g. grasses and mosses) it is easier to estimate percentage cover. For this purpose a quadrat with internal divisions is recommended – one with 100 5cm x 5cm squares is particularly useful. Results from several quadrats can then be averaged and scaled up to get an estimate for the entire survey area.
Important things to remember
• The number of samples you take (i.e. the number of times you deploy your quadrat during your survey) will affect the reliability of your results. Sample sizes which are too small are much more likely to be affected by anomalous counts (e.g. localised clusters of individual species). On the other hand, planning for too many samples can create an impractical workload.
• Bear in mind that there will always be observer bias. By their nature, flowering plants are easy to overestimate and low-growing species are more likely to be missed.
• Take care to make sure that your quadrats are randomly placed if your survey design requires this. It is easy to subconsciously place them where there are large numbers of flowers or easy to count species. Using a coordinate-based system will solve this problem.
Quadrats available from NHBS
At NHBS we sell a selection of high-quality quadrats, designed to be strong, long-lasting and durable.
 Q1 Quadrat
Made from heavy gauge steel wire with zinc plating, the Q1 Quadrat measures 0.5m x 0.5m and has no divisions.
 Q2 Quadrat
The Q2 Quadrat is made from heavy gauge steel wire with a plastic protective coating. The 0.5m x 0.5m frame is subdivided into 25 squares for sampling dense vegetation or species-poor habitats.
 Q3 Quadrat
The Q3 Quadrat is made from heavy gauge steel wire with plastic coating. The 0.5m x 0.5m frame is subdivided into 100 squares for calculating percentage cover or making presence/absence recordings.
 Q4 Quadrat
The Q4 Quadrat is a strong collapsible quadrat made from four pieces of heavy gauge steel wire with zinc plating. A single Q4 frame will make a 0.5m x 0.5m open frame without divisions, suitable for general vegetation surveys. Additional units can be used together to make a variety of quadrats, e.g.. 1m x 1m or 1m x 0.5m. Being collapsible means it is also ideal for travel.
Photo credits:
(a) U.S. Fish and Wildlife Service Headquarters via Flickr (CC BY 2.0)
(b) USFWS Pacific Southwest Region via Flickr (CC BY 2.0)


