To see accurate pricing, please choose your delivery country.
 
 
United States
£ GBP
All Shops

British Wildlife

8 issues per year 84 pages per issue Subscription only

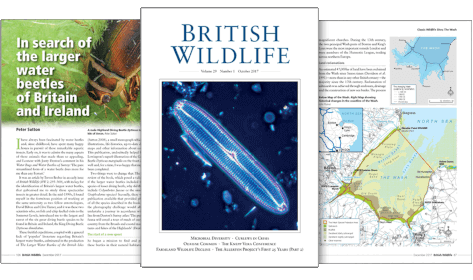
British Wildlife is the leading natural history magazine in the UK, providing essential reading for both enthusiast and professional naturalists and wildlife conservationists. Published eight times a year, British Wildlife bridges the gap between popular writing and scientific literature through a combination of long-form articles, regular columns and reports, book reviews and letters.

Subscriptions from £33 per year

Conservation Land Management

4 issues per year 44 pages per issue Subscription only

Conservation Land Management (CLM) is a quarterly magazine that is widely regarded as essential reading for all who are involved in land management for nature conservation, across the British Isles. CLM includes long-form articles, events listings, publication reviews, new product information and updates, reports of conferences and letters.

Subscriptions from £26 per year
Academic & Professional Books  Reference  Career and Professional Development

Presenting Scientific Data in R Creating Effective Graphs and Figures

Handbook / Manual
By: Rosalind K Humphreys(Author), Graeme D Ruxton(Author)
188 pages, colour & b/w illustrations, tables
Presenting Scientific Data in R
Click to have a closer look
  • Presenting Scientific Data in R ISBN: 9780198870470 Paperback Jul 2022 In stock
    £26.99
    #257124
Price: £26.99
About this book Contents Customer reviews Biography Related titles

About this book

Written primarily for students embarking on an undergraduate bioscience degree, this primer provides an accessible, straightforward, and approachable guide to data presentation using R. It offers valuable and widely applicable advice on how to choose the most appropriate type of graph for different types of data, and guides readers from the basics of plotting clear figures to producing polished and effective visuals, illustrating the core concepts and features of excellent graphing. This primer uses simple and engaging biology-based example data sets to take readers from the essential aspects of basic plots to more advanced graphing techniques and details.

Contents

1. Introduction and getting started
2. Pie charts and tables for qualitative data
3. Bar charts for qualitative data
4. Presenting single-sample data: Histograms and boxplots
5. Comparing multiple samples: Boxplots and histograms
6. Scatterplots for quantitative data
7. Customizing everything using R: Day-to-day
8. Customizing everything using R: More specialist

Customer Reviews

Biography

Rosalind Humphreys is a researcher at the University of St Andrews. Rosalind's research focuses on the behavioural and evolutionary ecology of interactions between species, but she has published peer-reviewed papers on statistical topics as well as reviews and original research articles concerning predator-prey interactions. Rosalind also acted as sole graphics designer for the Oxford Biology Primer Power Analysis: An Introduction for the Life Sciences by Colegrave and Ruxton (2020).

Graeme Ruxton is a Professor of Evolutionary Ecology at the University of St Andrews. Graeme has co-authored (with Nick Colegrave) four editions of the OUP textbook Experimental Design for the Life Sciences. With a long history of publishing papers aimed at improving the design and analysis of experiments, Graeme has a particular interest in making the principles of data analysis readily accessible to a wide range of learners.

Handbook / Manual
By: Rosalind K Humphreys(Author), Graeme D Ruxton(Author)
188 pages, colour & b/w illustrations, tables
Current promotions
New and Forthcoming BooksBest of WinterNHBS Moth TrapBuyers Guides